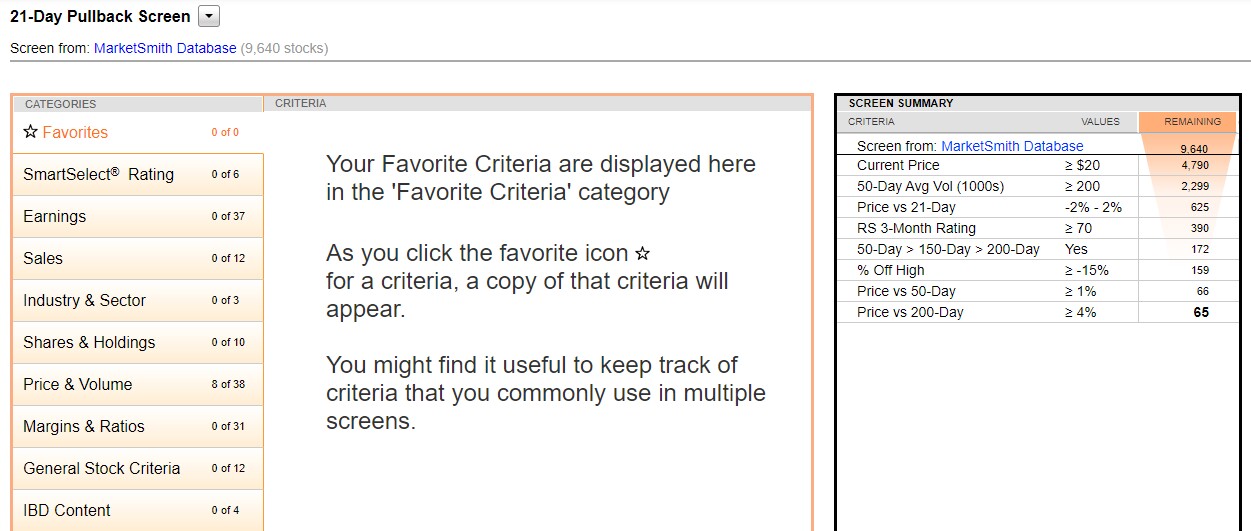

There are 3 main screens I run nightly.
You can recreate them with the parameters given and adjust anything you want. For example, you can change the share price, etc. You can also click on any of the images to see what the screens should look like in MarketSmith
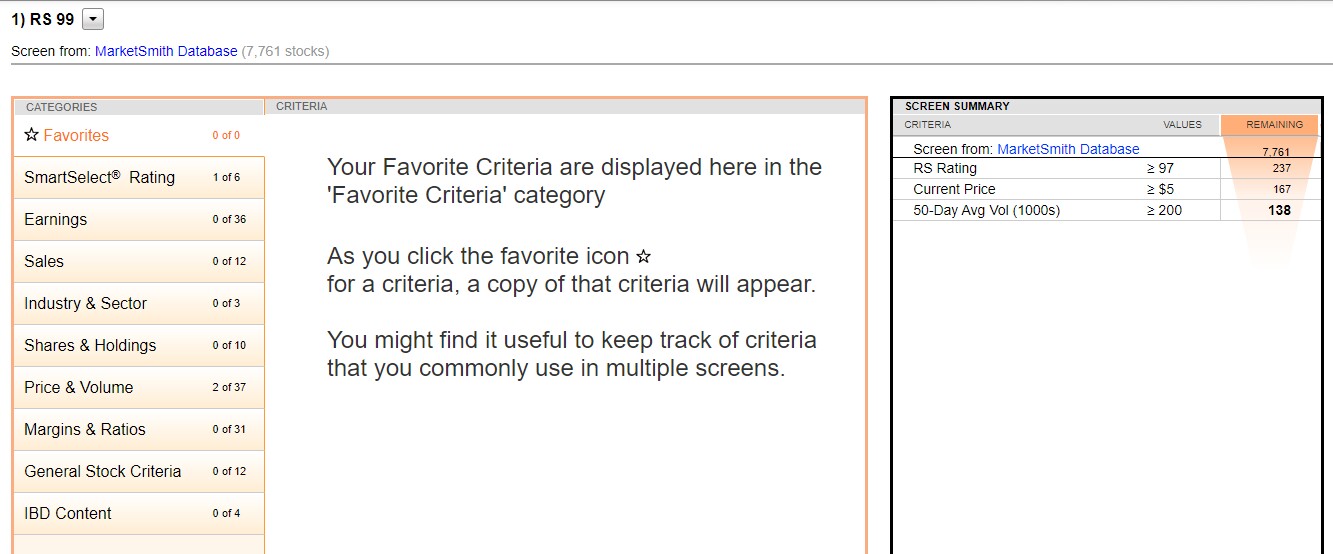
1) RS 99 Screen
RS Rating ≥ 97
Current Price ≥ $5
50-Day Avg Vol (1000s) ≥ 200
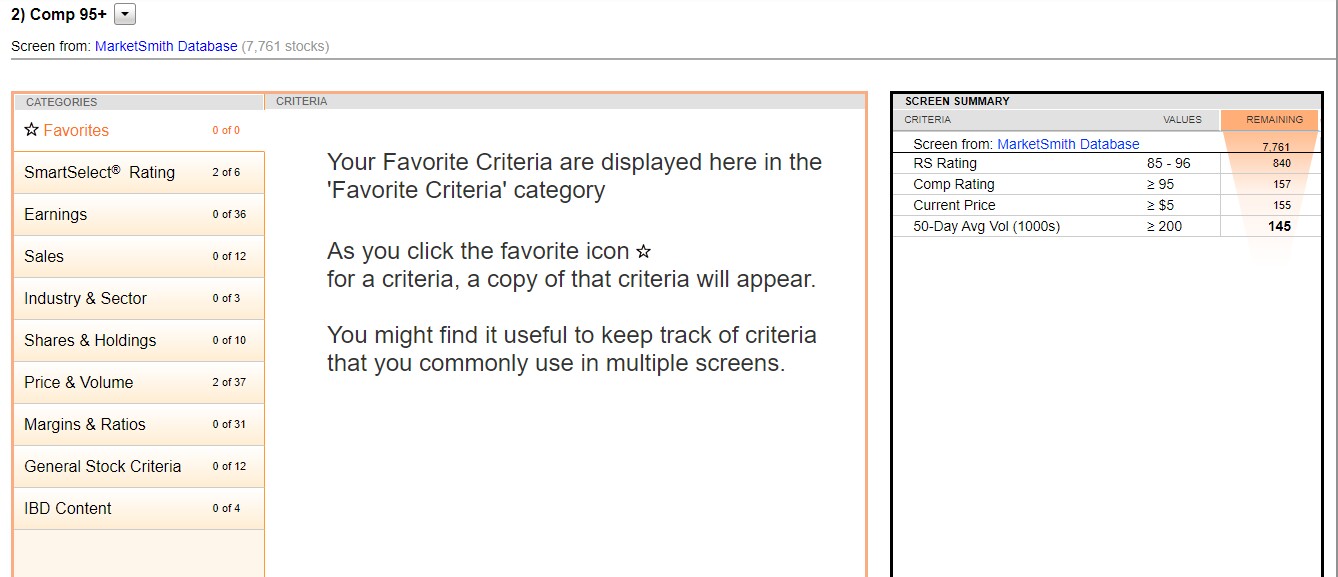
2) Comp 95+ Screen
RS Rating 85-96
Comp Rating ≥ 95
Current Price ≥ $5
50-Day Avg Vol (1000s) ≥ 200
3) Comp 95- Screen
RS Rating 89-96
Comp Rating ≤ 94
Current Price ≥ $5
50-Day Avg Vol (1000s) ≥ 200
EPS % Chg Last Qtr (+/-) ≥ 20%
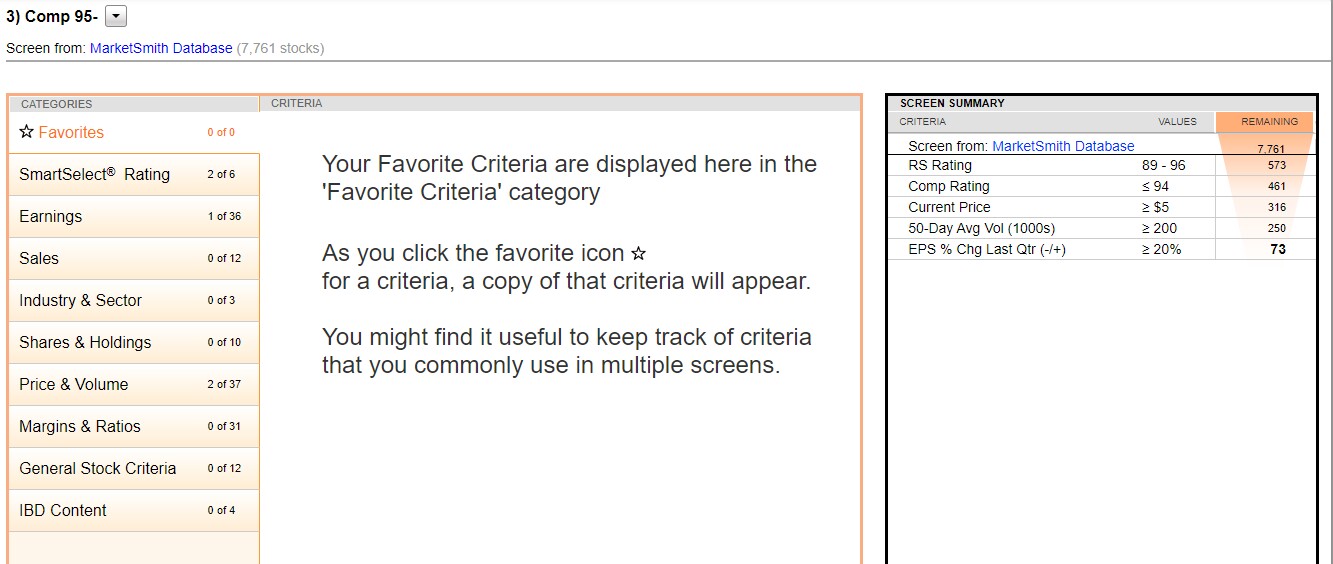
These first 3 screens above have no overlap and give me a good feel for stocks acting well on both a relative strength and earnings basis.
There are a few other screens I look at that are built into MarketSmith:
1) On the bottom left hand side, under Reports, Stocks, I look at Top 150 RS Rating Stocks. There is some overlap but I like to see which names show up repeatedly.
2) Same folder, Top Rated IPO’s
3) MarketSmith Growth 250: IPO 1 Year
Below, you will find 5 screens that I run regularly.
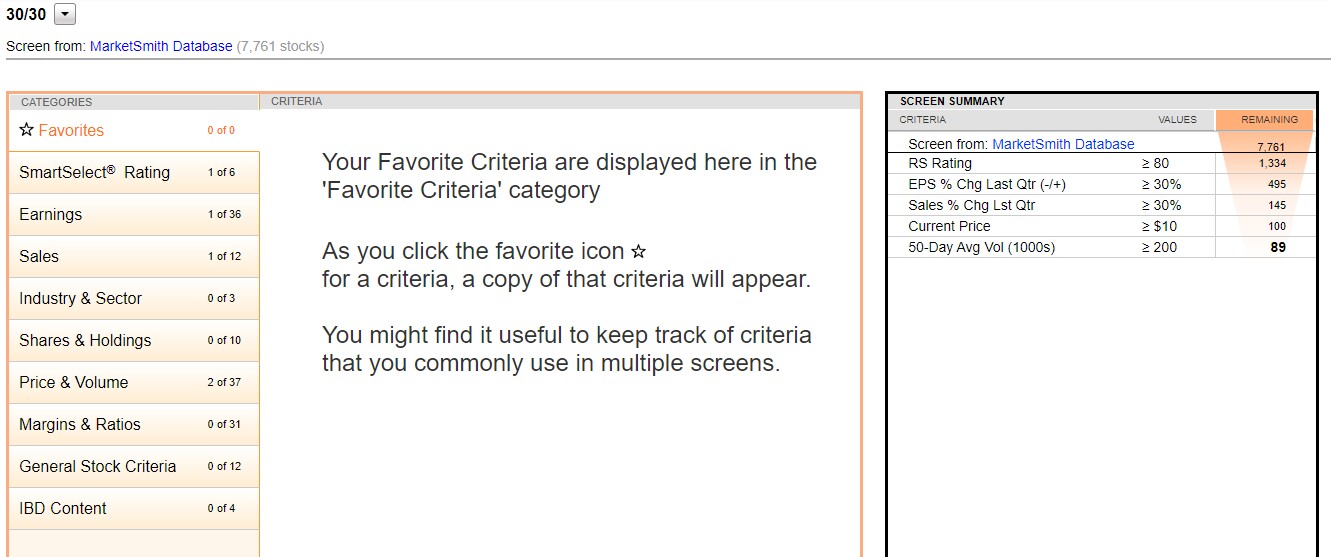
1) 30/30 Screen
RS Rating ≥ 80
EPS% Chg Last Qtr (+/-) ≥ 30%
Sales % Chg Last Qtr ≥ 30%
Current Price ≥ $10
50-Day Avg Vol (1000s) ≥ 200
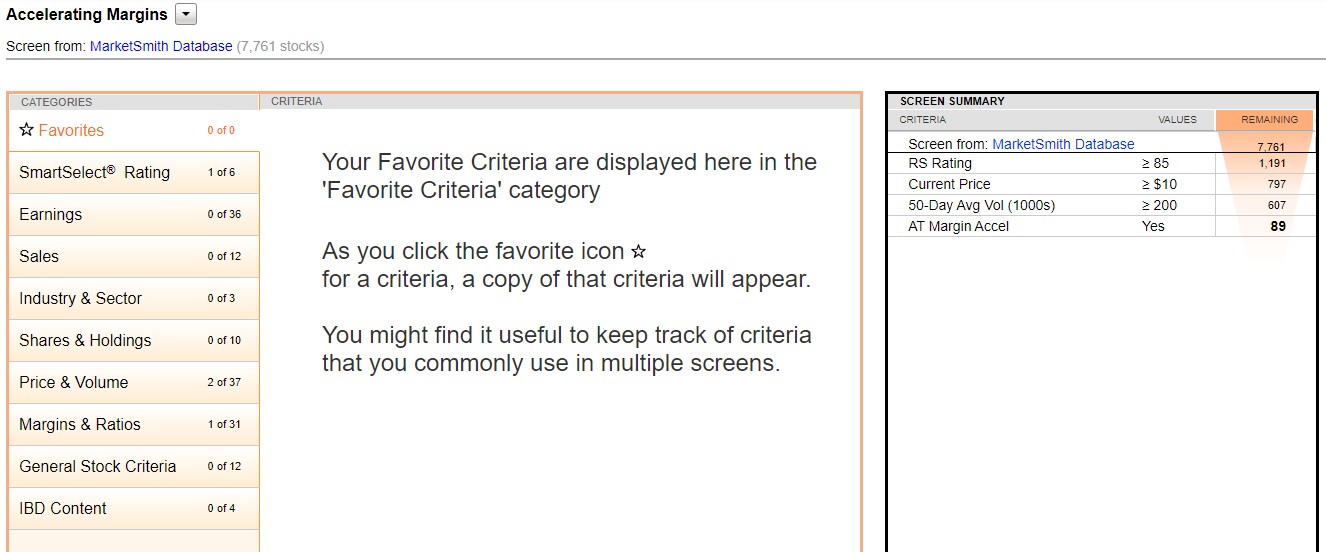
2) Accelerating Margins Screen
RS Rating ≥ 85
Current Price ≥ $10
50-Day Avg Vol (1000s) ≥ 200
After Tax Margin Accel – Last 3 Qtrs: Yes
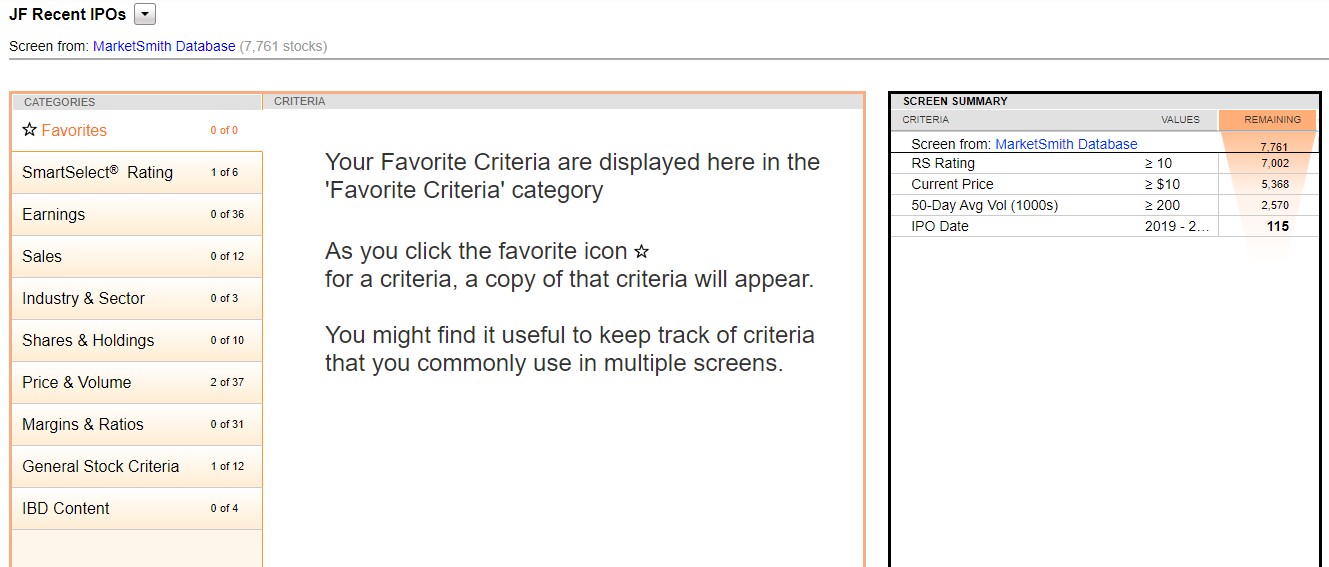
3) Recent IPO Screen
RS Rating ≥ 10 (The reason it is so low is that many IPOs don’t have enough history to register a proper RS rating. You can adjust this higher if you want)
Current Price ≥ $10
50-Day Avg Vol (1000s) ≥ 200
IPO Date 2019-2020 (you can also adjust this and go back more years if you want)
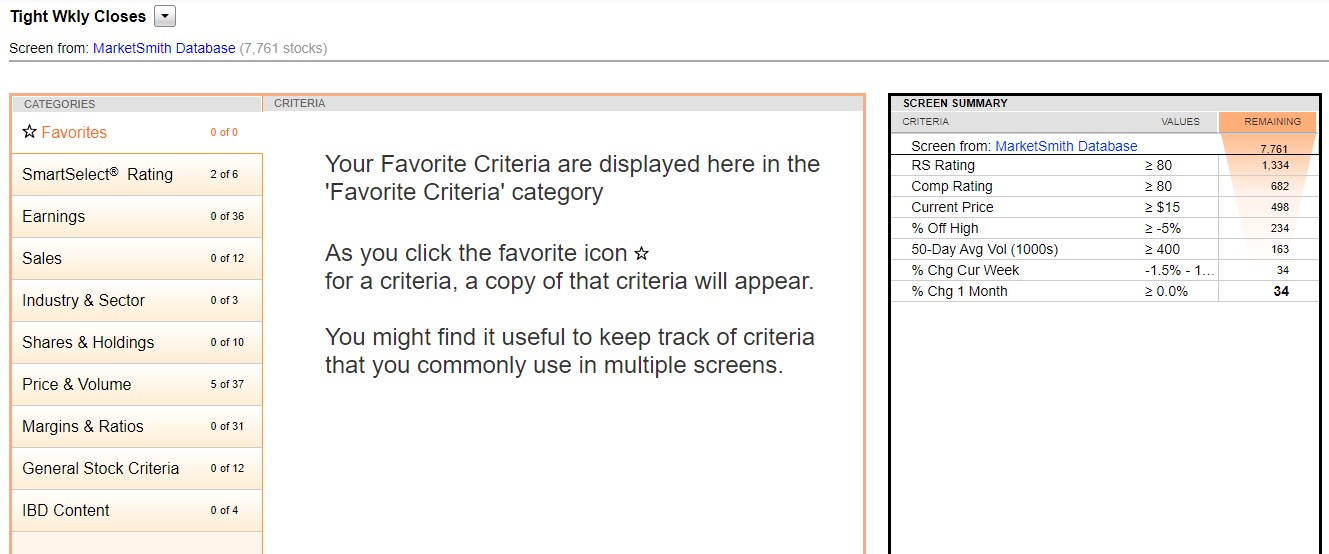
4) Tight Weekly Closes Screen. This is a screen from Scott O’Neil. As with any screen, you can adjust whatever parameters you want.
RS Rating ≥ 80
Comp Rating ≥ 80
Current Price ≥ $15
% Off High ≥ -5%
50-Day Avg Vol (1000s) ≥ 400
% Chg Cur Week -2% to 2% (I increased these parameters in April 2021 because the old range was not producing any stocks)
% Chg 1 Month ≥ 0.0%
5) 21-Day Pullback Screen
Current Price ≥ 20
50-Day Avg Vol (1000s) ≥ 200
Price vs 21-Day -2% to 2%
RS 3-Month Rating ≥ 70
50-Day > 150-Day > 200 Day Yes
% Off High ≥ -15%
Price vs 50-Day ≥ 1%
Price vs 200-Day ≥ 4%