Over the past two months, four technical indicators and statistics occurred that basically signal we could see more strength over the next 12 months.
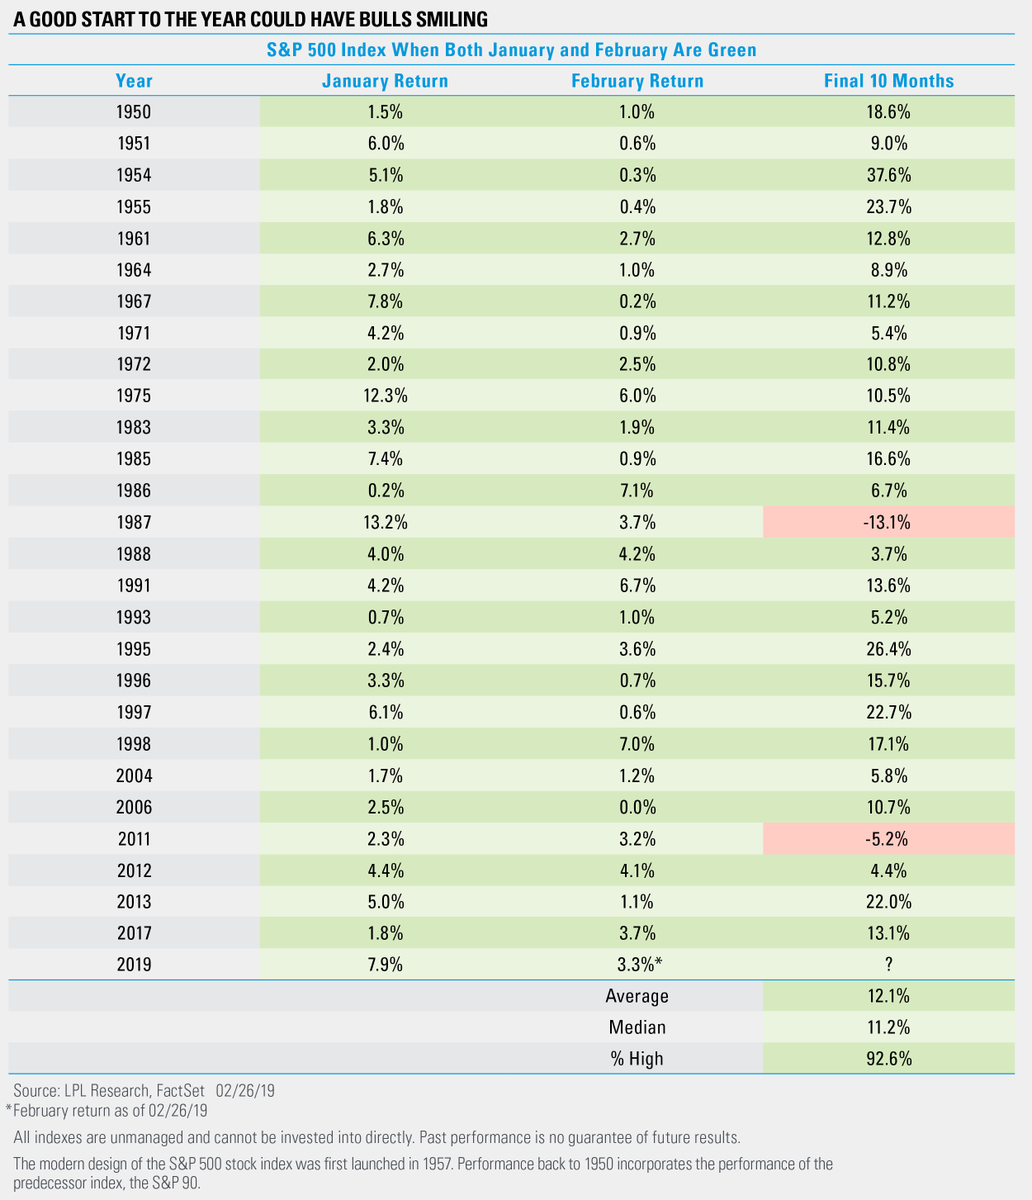
1) The first statistic is when the S&P 500 is positive in both January and February. Since 1950, this has happened 27 times and the final 10 months were higher 25 times for an average gain of +12% (vs. the average final 10 months return of +7.6%). The table below is courtesy of Ryan Detrick, Senior Market Strategist at LPL Financial.
2) The second is called the 2-to-1 Blastoff Indicator, which was developed by the famous investor Martin Zweig. It occurs when, over any 10-day period, the number of advancing stocks on the NYSE outnumbers declining stocks by an average of at least two to one. That’s exactly what happened from 12/26/18 to 1/9/19 and usually signals the start of a potential new bull market. According to Mike Cintolo, the Chief Analyst at Cabot Growth Investor, “Such powerful upside momentum is rare to see. This signal has occurred just 10 other times since 1960. Three months later, the S&P 500 has rallied as much as 12%; six months later, as much as 18%; and a year later, as much as 25%!”
3) On 2/20/19, an even broader breadth thrust flashed when 90% of NYSE stocks closed above their 50-day moving average. According to Cintolo, “There have been just 11 prior signals since 1970. On average, the S&P 500 is up more than 13% six months later, with all instances up three, six and 12 months after the signals.” In addition, when 90% of S&P 500 stocks closed above their 50-day lines, and the S&P had been below its 200-day line during the prior three months (which happened in February), it’s also led to excellent returns in the months ahead.
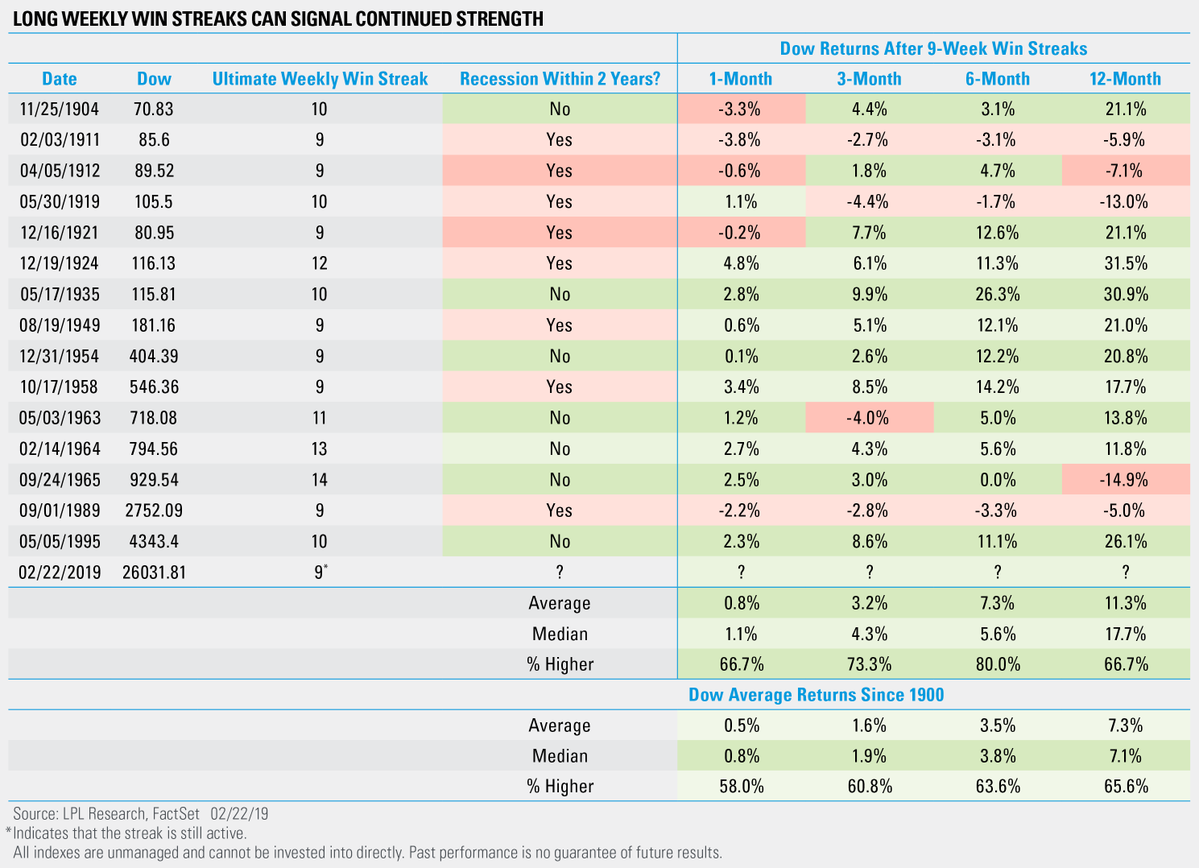
4) The fourth statistic is about the recent Dow Jones nine-week win streak. According to Detrick, returns after these win streaks are quite strong, much stronger than the average returns. Detrick says “There have been 15 other nine-week win streaks since 1900, and a year later the Dow’s median return was nearly 18%.” In addition, recent history says a recession within two years of this rare event is not likely.
The main point behind all these statistics and indicators is that strength usually leads to more strength. Of course we could see a pullback over the near-term, but the studies show they will likely be buying opportunities. With the Federal Reserve on hold with their interest rate hikes, they are no longer an enemy of the stock market. Also, a favorable tariff resolution could be on the horizon with both the US and China looking to make a deal soon. As Cintolo concludes, “Whatever your favorite blastoff indicator, the main point is that many signposts point toward the market being nicely higher down the road.”
I can be reached at: jfahmy@zorcapital.com
Disclaimer: This information is issued solely for informational and educational purposes and does not constitute an offer to sell or a solicitation of an offer to buy securities. None of the information contained on this site constitutes a recommendation that any particular security, portfolio of securities, transaction, or investment strategy is suitable for any specific person. From time to time, the content creator or its affiliates may hold positions or other interests in securities mentioned on this site. The stocks presented are not to be considered a recommendation to buy any stock. This material does not take into account your particular investment objectives. Investors should consult their own financial or investment adviser before trading or acting upon any information provided. Past performance is not indicative of future results.